
Looker Studio is a powerful reporting and visualization tool that enables you to create engaging and insightful dashboards with just a few clicks.It is a simple tool, but if you know the proper implementation procedure, then you may easily create dashboards that visualize data in a more engaging way. Follow this updated version of the Looker Studio tutorial to acquire the sufficient knowledge for creating dashboards.
It helps you create interactive dashboards and reports by connecting and blending different data sources like
Google Analytics, Google Ads, Sheets, BigQuery, MySQL & more.
In this article, we will guide you to learn the basics of Looker Studio and learn how to create your first report.
What is Google Looker Studio (Formerly Data Studio)
Looker Studio is an open source kind of business intelligence (BI) tool developed by Google in 2016 formerly known as Data Studio and rebranded in October 2022.
Initially, it was free, but Google has gradually added more features, leading to the release of a Pro version. Nonetheless, the free version contains all the useful features for basic to complex report creation.
Looker Studio is a cloud-based tool accessible with an active Google account, such as Gmail. It automatically stores your files in Google Drive, ensuring your data remains safe even in cases of system corruption or sudden power loss.
How To Start Using Looker Studio
To start using Looker Studio, you’ll need an active Google account.
- Sign in at https://lookerstudio.google.com/.
- After signing in, you’ll land on the Looker Studio homepage, which provides access to your reports, data sources, and explorations.
- The homepage includes options to create new reports, connect to data sources, and explore templates.
For a visual reference, here’s a screenshot of the Looker Studio homepage
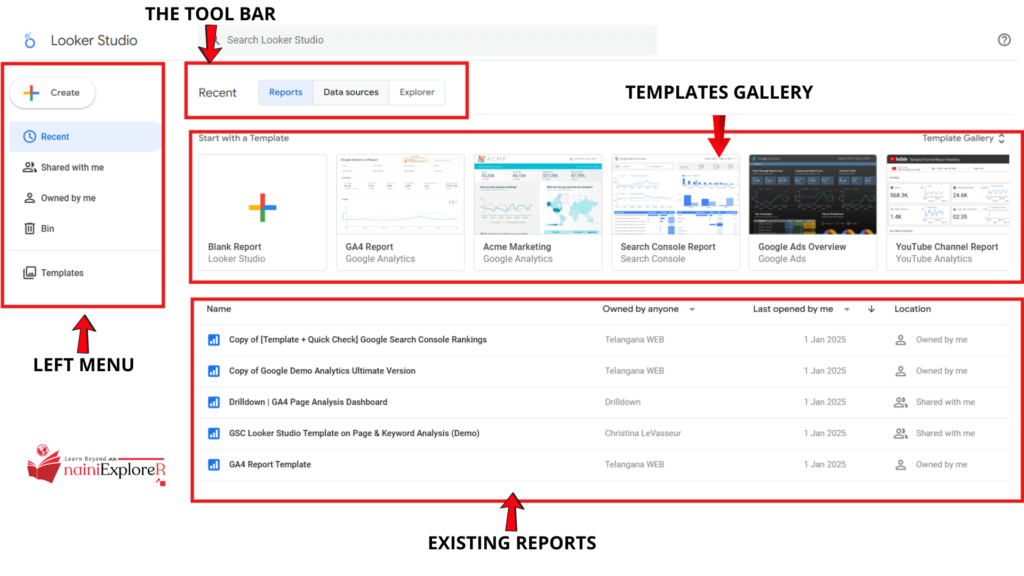
The Left Menu: It contains the information about create a report, templates, shared with me, owned by me shortcuts for easy access into the reports.
Toolbar menu: which gives you
- Access of all of your reports, and data sources
- Explorer provides an opportunity to tweak a chart without changing the report (basically rough report)
Templates Gallery: Which helps you find existing templates provided by Google for quick marketing purposes, and you will also find other 3rd party templates with more advanced features. With just a single click, you will be able to create the reports and start analyzing your data.
Existing Reports: Which lets you view reports which you created and those shared with you also, similar to Google Sheets and Docs.
Data Source and Connectors in Looker Studio
Every time you create a report, you first need to create a data source.
The most important thing to remember is that a data source is not your original data; it is just a medium, like an SQL query, used to connect to your original data based on your requirements.
For more clarity, carefully review the following points:
- Data Set: This is the original data, which might be in the form of CSV files, SQL files, etc.
- Data Connector: This is the medium that connects the data source to your report. Looker Studio provides default connectors, including GSC, GA4, Google Ads, etc.
Metrics and Dimensions in Looker Studio
Metrics and dimensions are important factors in any visualization tool, including Looker Studio. Before diving into these two concepts, it’s essential to understand the clear difference between metrics and dimensions.
Metrics represent data in numerical form also called Quantitative data.
- Examples of metrics in GA4 include sessions, time, users, etc.
- In GSC, examples include impressions, clicks, and average position.
Dimensions, on the other hand, provide descriptive data in textual form also called Qualitative data.
- Examples of dimensions include city, country, URL, etc.
Note: Use dimensions to group data and measures to calculate values.
What are The Prerequisites You Must Have
- A valid Google Account (to access Looker data studio)
- Data source (example – Google sheets, GA4, CSV files etc.)
Things To Know Before Creating A Basic Looker Report
1. Set Up Data Sources
- Connect to sources like Google Analytics, Sheets, BigQuery, or CSV files.
- Go to Data Sources > Create Data Source > Choose your connector.
2. Create a Report
- Click Blank Report > Select a data source.
- Use the toolbar to add charts, tables, or filters.
3. Build Visualizations
Drag-and-Drop Fields
- Dimensions (e.g., Country, Product) go to rows/columns.
- Metrics (e.g., Sales, Users) go to values.
Chart Types:
- Bar charts, line graphs, pie charts, maps, etc.
4. Customize Styling
- Adjust colors, fonts, and themes under the Style tab.
- Add headers, images, or text boxes for context.
5. Add Filters & Date Ranges
- Use Filter Controls to let users refine data (e.g., region, date).
- Set default date ranges (e.g., “Last 30 days”).
6. Share & Collaborate
- Click Share > Grant view/edit access via email or link.
- Embed reports in websites or export as PDF.
Advanced Features in Looker Data Studio
Blending Data Sources
Blending data sources is one of the main features in this tool. With this, you are able to blend two different data sources together to view and analyze data and get accurate insights. For example, blending Google Search Console with Google Analytics 4 can provide greater insights. In fact, you can blend multiple data sources, including complete digital marketing reports from GSC, GA4, Google Ads, Facebook Ads, Instagram Ads, YouTube Ads, etc. By blending all these together, you can see and analyze the data. Essentially, this feature gives us significant power to analyze data comprehensively.
Calculated Fields
Using this feature, we can create custom dimensions and metrics, such as profit, profit percentage, CTR, impression-to-click ratio, revenue share, etc.
Schedule Email Updates
Using this feature, we can create email updates to be sent daily, weekly, or monthly to shareholders or clients. This provides proper collaboration and communication.
Theme and Report Settings In Looker Studio
Basic settings help create standardized reports at the initial stage. In this section, you will be able to set the report page size – for example, you can choose portrait or landscape orientation. You can also set the default background color, default data source, and theming structure such as default fonts.
Best Practices for Looker Studio Reports
Follow the effective design principles including logos, brand colors, etc. Set up brand colors and backgrounds for metrics or charts that work best. According to these principles, consistency and readability are very important – don’t overlook them during the complete creation process. Reports should be easy to understand with well-presented data.
Padding and alignments are essential for better visualization and styling. You can extensively use styling options to create more beautiful designs.
The next important consideration is knowing what kind of chart is appropriate for different types of data. To achieve this, you can move forward by taking inspiration from the internet, which will give you some ideas before mocking up your design.
After dashboard creation, you need to optimize the report by deleting unwanted data sources, filters, and custom metrics. Last but not least, you must maintain documentation for future reference and implementation strategies.
Final Summary
This tutorial covers the essential topics of Looker Studio. By learning these topics, you will gain the knowledge needed to create your first report and analyze data with maximum impact. Google frequently updates its documentation and provides many enhancements in the form of visualizations, styling options, theme settings, and other new features.